Fin dag på sjøen med geofagelever

Da var feltdelen av arbeidet gjennomført med årets Geofag 2-elever. Vi har hatt en strålende flott dag på sjøen med FF Hans Brattstrøm. Vi fikk gjennomført et CTD-snitt m/strømmålinger over Hjeltefjorden, fra Ramsøy og over til Ågotnes, samt en stasjon i Vågen, like ved skolen vår.

En første kikk på dataene mens vi fortsatt var om bord på båten viser at vi ser den første delen av høstprofilet i temperaturen i fjordsystemene utenfor. Nå gjelder det å koble disse dataene til det været vi har hatt de siste ukene. Her ligger det grunnlag for mange gode diskusjoner rundt resultatene 😀

Jeg tror elevene også koste seg, vi har i alle fall vært veldig heldige med været! 2-5 m/s vind, og delvis skyet og 18-19 grader i luften. Det kan nesten ikke bli bedre!

Bildene under er bilder som jeg har tatt i dag, jeg har prøvd å holde elever og mannskap unna bilder som havner i bloggen min.

Våre to hovedinstrumenter - en CTD og en Seaguard (strømmåler). Foto: Elisabeth Engum
Hjeltefjorden i nydelig augustvær Foto: Elisabeth Engum
Herlig innseiling i Vågen Foto: Elisabeth Engum

Forberede tokt

Kart over området

I morgen – onsdag 26.august 2009 – skal Geofag 2-elevene fra Bjørgvin på tokt med F/F Hans Brattstrøm i forbindelse med EU-prosjektet CarboSchools. I år har jeg valgt å fokusere studieområdet litt nærmere skolen enn vi gjorde i fjor. Siden jeg ikke er så opptatt av biologi, så dropper jeg bunnskrapen og planktoninnsamlingen, og vil heller fokusere mer på temaene som er interessante i forhold til geofag – karbonkretsløpet med opptak/utslipp av CO2 i sjøen, samt havstrømmer og værvarsling.

Vi kommer til å gjennomføre en målestasjon i Vågen (sentrum), like ved skolen. Vågen blir derfor vår geotop i Geofag. Her er tanken at vi kan samle inn dataverdier fra kaien i løpet av året i tillegg til de dataene vi samler inn fra båt. Vi vil derfor – forhåpentligvis – få et nærere forhold til geotopen enn om den er i eksempelvis Korsfjorden.

Planen for i morgen er tredelt, minst: 1) Elevene er nødt til å ha et fokus på sikkerhet ved forskningsarbeid om bord på et forskningsfartøy; 2) Elevene skal lære seg å kjenne flere nye måleinstrumenter og kunne bruke disse – det er spesielt en CTD (=Conductivity Temperature Depth) som måler salinitet og temperatur med dypet, og en strømmåler; 3) Elevene skal også trene seg på å gjøre litt værobservasjoner, siden vi skal ha mye om værvarsling senere i år. I tillegg skal vi ta noen vannprøver som elevene skal analysere på ene laboratoriet på Universitetet i Bergen – dette blir vannkjemi – utregning av alkalinitet og dermed total uorganisk karbon i vannprøven. Disse verdiene skal elevene bruke til å gjøre beregninger på fluks av CO2. Etter toktet vil vi forsøke å bruke profilene av temperatur og salinitet langs et snitt over Hjeltefjorden til å si noe om tetthetsgenererte havstrømmer, og en diskusjon på om havstrømmene i Herdlefjorden er tetthetsstyrt, eller om tidevann og vind har minst like mye å si for målt strøm.

Jeg gleder meg til å dra i felt med elever i morgen. Jeg føler meg privilegert som lærer som med god grunn kan ta med elever på denne typen aktiviteter. Og så håper vi jo at det kan være med på å rekruttere flere realfagsstudenter i fremtiden J

CarboSchools – Citizenship

Another late blog post – this one in Norwegian…

Sally: How can I motivate a group of children to learn more about their CO2 emissions?

  • get them wondering first
  • measuring the hand held CO2 meter and walking around the school area, inside and outside
  • elevene er unge, og for de er det viktig å kunne måle noe de ikke kan se
  • produserer vi mer CO2 under en matematikkprøve enn ellers?

Elevene målte størrelsen på klasserommet, antall gutter og jenter samt vekten deres, dette ble brukt i matematikkundervisningen. Deretter ble sensoren plassert i klasserommet, gjennomsnittlige verdier hvert 10ende minutt.

To elever fikk i oppgave å notere alt som skjedde i klasserommet: npr gikk folk ut og inn, når ble dører åpnet og lukket, hvor mange vinduer var åpne, hvor lenge. Så de hadde masse og gode datamateriale.

Man hadde dermed et bakgrunnsmateriale.

Deretter inkluderte de planter i klasserommet for å se om det hjako.

Stearinlys brant for å simulere fossile brensler

Et akvarium med ferskvann ble plassert i rommet for å se endringen i pH ved svært høye CO2 verdier i klasserommet. Akvariet hadde også en luftpumpe for å lufte ut vannet, for å ha maksimal kontakt med luften, og dermed økningen i CO2.

Plantene påvirket verdier spesielt når det ikke var elever tilstede.

Med stearinlys økte CO2verdiene betydelig, både med og uten stearinlys (dette passer sammen med forskerspiren og hypotesetesting i Vg1 naturfag)

Plantene “spiser” opp CO2 raskere etter at stearinlysene er slukket

Grafene ble hengt opp på veggen, inndelt i 8 ulike timer. De elevene som hadde skrevet opp alt som hadde skjedd, lagde et sammendrag av hva som hadde skjedd i de aktuelle timene, og disse ble knyttet til grafene, slik at elevene som ikke hadde gjort dette kunne lese av teksten og knytte dette til grafene.

CarboSchools Library

clip_image002It’s been a while since the last blog post about the meeting in Pistoia. On the second day we had a parallel session – I was chair person for the teachers – “Teachers’ view on CarboSchools Library: What materials do we need to teach Carbo-Topics? What materials do expect to get from CarboSchools = find in the CarboSchools library?”

Here is the results from our discussion (which were sent to the CS organizers)

Experiments

  • Must have a quality check of all the resources that is put out, if we teachers know that it is checked, it might be easier to send away our ideas / experiments / projects
  • Hands-on experiments
  • Include documentation of “how to”
  • Yesterday’s presentations
  • Include background information for teachers these could be links to external pages (remember to include date and time for the link when it was added – Google Cache)

Teaching resources

  • Access to new research results, hopefully together with ideas to activities connected to the new research
  • Quality check
  • Ideas for projects that can be used “in the classroom” / with students
  • Animations

Instruments

  • “Instrument” library w/tutorials – list over instruments that can be borrowed at the research institutes
  • Reviews of different instruments – recommendations of good instruments, also about experiences that was not so good

Organization

  • The content must be organized
  • Main topics / categories – links to the main topics where the experiments are found
  • Search engine (if the content grows)
  • Discussion forum for teachers and students
  • Possibility to find partner schools / teachers – contact information to CS teachers and teachers who uses CS library and are interested in collaboration with other teachers who are doing CS experiments / projects
  • Section that includes final results from / with students (videos, animations, reports etc) – can be in native language, but should include an abstract in English

Where do we usually find them?

  • SchoolCO2Web
  • Wikipedia
  • Google
  • Encyclopaedias
  • Local universities (reports, booklets, scientists)
  • Local research institutes
  • Booklets from CS
  • Country websites about climate
  • Online journals
  • Online teachers’ resources
  • Newspapers
  • Conferences

CarboSchools: General CO2 chemistry (Sharing Experiments cont.)

Mariana Pirillo (Italy): Demonstration of different chemical reactions which produce CO2

Mariana starts by telling us that the teaching in the Italian schools are quite different from what I’m used to. All the lessons are based as lectures, with no room for the students to work with exercises, tasks, experiments, collaborative work etc in the school. This is something the students are supposed to do after school (more like our universities). This means that it can be hard to find enough time to do these hands-on experiments.

But she has found her way – and her recipe for getting the students involved is:

  1. Ask a question (or two) – “Why are we interested in CO2?”
  2. Get the students to do some background research
  3. Then get them to make a hypothesis before doing the experiment
  4. Testing of the hypothesis by hands-on experiments
  5. Communicate your results

Experiments:

Making CO2 of fizz powder.

  1. Weight of CO2 – fill two balloons, one with air (air pump) and one with CO2. Which balloon is most heavy?
  2. CO2 in water – what happens with the pH?

Sally (Germany): Demonstration of experiments on CO2 in seawater (solubility, buffering capacity, CO3)

Sally showed experiments that she has used with her 11-14 year old students, but these experiments can be used with students all the way through high school as well.

She starts up with the red cabbage experiment to get the understanding of acids and bases.

Then she addresses the main question for the students:

“Why and how can seawater be a sink of atmospheric CO2?”

Two glass jars – one with freshwater and one with seawater. Add acid (vinegar) and base (soap), and measure the change in pH for every drop that is added. Hopefully the students will see the buffer capacity of the seawater.

“Why has seawater this buffer capacity?”

Blow (CO2) in the glass jars (with/pH sensors in them, close the opening with cotton) until the pH doesn’t change anymore. “Why?”
Compare freshwater and seawater.

Crush some eggshell and put this in the freshwater that is saturated with CO2. Check the change in pH.
Do the same with the acidic seawater, and compare the results. The eggshell will not dissolve in the latter because the pH will not be low enough (it is of course a time issues though…)

Addition of carbonate will raise the pH value again.

It is possible to have an experiment with algae, and see the effect of phytoplankton on pH and CO2.

Solubility of CO2 and temperature

Sally found the idea for this experiment on the internet, but has modified it for her students. Fizz tablets in water, measure amount of gas, compare warm and cold water.

Sally uses these experiments with quite young students, but I can use these with my upper secondary students as well. Interesting.

CarboSchools: Meteorology (Sharing Experiments cont.)

Maddalena Macario (Italy): CarboSchools.org an open source for teaching environmental education

Maddalena has focused on the Earth’s Atmosphere in her CarboSchools teaching. The context is the third year at upper secondary school (16 yrs old), after they’ve studied the gasous substances.

Duration of activity: 6 hours

Started up with lectures about the atmospheric composition and different meteorological phenomena. Weather forecasts, extreme weather, energy balance, humidity…

Maddalena has experience from different hands-on experiments, and she has found some ideas at the CS library. One experiment about humidity and saturation, and expanded with including aerosols to see how that effects the saturation values.

They also have a weather station at this school in Prato, and they have included their data at SchoolCO2web.

image

Hmmm, I’ve tried to draw the same graph as Maddalena did – with air pressure and humidity in the same graph, but the is a database connection failure. Maybe there should be a table about which dates there exists data from the different stations??

Maddalena has combined graphs with measured humidity and air pressure with the students weather forecasts, to show the commection between a higher humidity and low pressures.

The third experiment is about the greenhouse effect. It looks a bit like Rocer’s experiment.
The fourth experiment is about cloud formation due to condensation particles. This experiment is the same as I experiences at the ASE conference earlier this year, and at the Geofag teacher’s course in Oslo. (Create cloud in a bottle: Water in a bottle – smoke from a match to include smoke particles – increase pressure bu squeezing the bottle).

One of the problems she has experienced: links to websites keep changing (important to include date and time for the web pages) – databases are not stable – SchoolCO2web is not stable, makes it hard to compare your own data with data from other schools in the CarboSchools programme.

Needs: dynamic sites (blogs, fora, exchanging experiences); a database with experiments categorized by theme, key words, age of the students; news letters from CS library.

My remarks: This was very interesting – she teaches a lot of the same themes as I have in my Geoscience lectures. Nice to meet someone with this experience 😉

Nå har jeg registrert meg på Bloggurat.

CarboSchools – Modelling (Sharing Experiments continues)

Marc Jamous – Regional Coordinator in France – Predicting CO2 scenarios through models

image

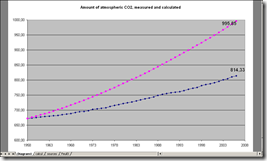
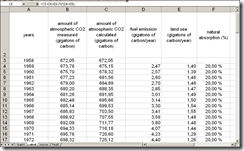
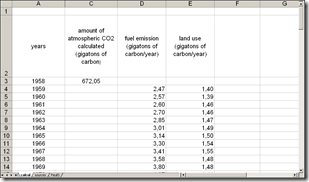
1958 was the first year that the total amount of atmospheric CO2 was measured, which is the reason for the start year for this simplistic model. In this model you start by the total amount of atmospheric CO2, and after that you add fuel emission and land use.

imageThe first step is to add the emissions to the atmospheric amount. The second step would be to compare the measured and the calculated CO2 data. The students will then see that there in a gap between the measured and calculated values – CO2 must be absorbed somewhere else then in the atmosphere.

image

The next step is to find a suitable value for the natural absorption, as a percentage of the emissions.

This is a great introduction to climate modelling as a discussion theme with our students.

Further on it would be possible to split natural absorption in absorption by the ocean and absorption by the vegetation.

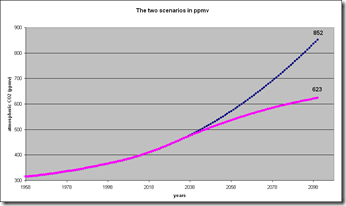
After making this model, it is now possible to include the prediction scenarios from the IPCC reports to calculate model results. It is also possible to get the students to make their own scenarios.

Camparison between the pessimistic and optimistic scenarios:

image

My concluding remarks: This was an easy but fantastic way of introducing the principles of climate modelling! I look forward to try this with my own students next year 🙂 I also want to thank Marc for sharing his files with us.

CarboSchools – SchoolsCO2web (Sharing Experiments continues)

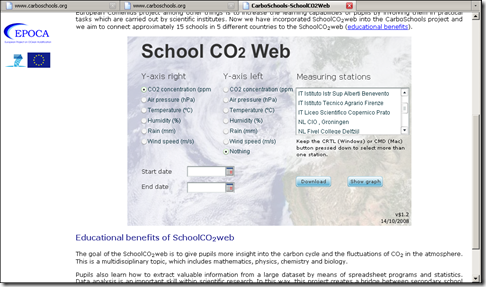
Through the CarboSchools collaboration there is made a website – SchoolCO2web.

Mirko (Germany): Collecting, analysing and showing CarboSchools data to the public

Mirko is teaching computer science and has used a weather station in the CarboSchools project. His students has worked on making a webpage with PHP and MySQL technology where they are displaying, analyzing and processing data from the weather station. The students has made a user platform and plotting functions.

They’ve used a Vaisala weather station, it looks like a Davis weather station, maybe it is possible to connect the weather station we’ve bought in my school? Connection to CO2net program.

The data needs to be sent via a ftp-server I need to check this with the ICT department in my school, if we have that possibility.

The goal was to publish the important data, and to visualize them in a sensible way. Other schools are invited to comtribute with their data.

Menno (Netherlands): Downloading and Analysing data from the SchoolCO2-Web

Menno is a regional coordinator in the TSP and/or CarboSchools in the Netherlands. He showed us how we can use the SchoolCO2web. For instance if you plot the CO2 levels with windspeed, you might see the effect of mixing on the CO2 levels. This is a great resource for teachers!

You can also download data from SchoolCO2web. Must remember that you can only download data for 1 month at a time. If you want to see videotutorials for displaying the data in Excel, Menno has published videotutorials at Youtube.

CarboSchools – Sharing experiments

May 1st – free time to finish my blog posts about the CarboSchools meeting in Pistoia.

Monday 27th of April it was time for Sharing Experiments. The morning session included Presentation of Experiments and Activities, whereas the afternoon session included parallel activities (workshops, outdoor activities, hands-on experiments, video showings, photo galleries, poster presentations)

Carbon Dioxide in the Atmosphere

Francesca (Italy): CO2 measurements in the different areas of the school

A short presentation of an experiment done with students at a school in Prato. They used an instrument for measuring CO2 in the schools classrooms with and without students, smoking areas, the school yard… The students also wanted to explore the difference in CO2 pressure with altitude – the school has four floors and the student did measurements in different heights. They presented their results at posters.

Anna (Spain) with teachers: Measurement of CO2 along a transect running from a higher to a lower altitude

3 different schools outside of Barcelona – measuring CO2 at different altitudes, looking for difference between the coast and further up the mountain sides.

  • differences between land and countryside due to land use
  • CO2 mixing due to wind, sea breezes, catabatic winds
  • inversion layers – instabilities in the atmosphere – orographic lift – convection

Conceptual objectives

  1. Learn how to measure meteorological parameters using proper devices
  2. Georeference technologies and topographic maps (GPS Google Earth)
  3. Work with spreadsheets
  4. Procedural objectives
  5. Apply the scientific method
  6. Develop autonomic skills
  7. Cooperative work between scientists, students and teachers

Material needed

  1. CO2 sensor with support (Vaisala)
  2. Portable meteorological station
  3. Solar radiation and rain protection (umbrella)
  4. Anemometer and barometer
  5. Topographic maps
  6. Filling in the worksheet
  7. GPS

Development of the activity

  1. Description of the measurement site
  2. Description of the meteorological situation
  3. Measurement of meteorological parameters
  4. Measurement for CO2 6 min
  5. Other interesting things  the site (traffic etc)

Later the students will meet as scientists and exchange their results with each other.

This was really interesting, I’d like to try some of this with my students, and maybe have a similar exchange with other schools in Bergen who teaches geo-science. I need more experience with the data loggers the school bought earlier this year.

Roser (Spain): Hands-On Experiments in the Classroom

Roser showed us several small hands-on experiments that she has used in her classroom – experiments that show the effect of CO2, water vapour and SO2 on temperature. Necessary equipment – glass jars, plasticine, temperature sensors, beakers, water, yeast, sugar / glucose, vinegar, sodic hydrogen carbonate. These experiments are easy to bring into our classrooms – this is what teachers want 🙂

Example – The greenhouse effect (this is from Roser’s own work)
What you need:
  • Three glass jars with lid. The lid has to have a hole to introduce the temperature sensor or the thermometer.
  • Plasticine
  • Temperature sensors or thermometers
  • Two beakers
  • Water
  • Yeast and sugar (glucose), or, vinegar and sodic hydrogen carbonate, which will provide CO2
  • Spoon
  • Light
The activity
  • To obtain CO2 there are two possibilities: mixing vinegar and sodic hydrogen carbonate or adding sugar to a mixture of warm water and yeast.
  • To obtain water vapour we will use a beaker with water.
  • You have to put a beaker with the mixture producing CO2 in a glass jar. Another beaker with water in another glass jar, and we also need an empty glass jar.
  • You have to put the three jars in the Sun with the sensors or the thermometers inside. We need an extra sensor or thermometer to measure the outside temperature. Be careful to put it in a place that has only contact with the air.
  • We will measure the initial temperature and the temperature changes every 5 minutes during 15 minutes if we are using thermometers or you can take continuous data if you have sensors. In each case note the temperature changes every 5 minutes.

CarboSchools – Saturday and Sunday

Sitting in airports – again 😉 Reflecting on the last few days, trying to summarize the project meeting that I have attended in Pistoia, Toscana, Italy. This blog post will have fractions of “cut and paste” from my notes taken during the sessions. (And it will be in English, since there might be some international readers to this post 😉 )

The meeting started Saturday afternoon, and this part was for the teachers participating in the project – here are teachers from Vienna (Austria), Jena & Kiel (Germany), Barcelona (Spain), Bordaux & Paris (France), Bergen (Norway), Copenhagen (Denmark), Gröningen (Netherlands), Beneveneto & Prato (Italy). The main reason why the coordinators find it very interesting that the teachers participate as well, is because the scientists and organizers lack hands-on experience from the classroom.

Saturday afternoon we got divided in two groups – one group for the teachers who are interested in forming a Comenius partnership (where I attended) and one group for teachers who were interested in international partnerships on the outside of Comenius. I asked – as the fresh teacher I still am – why someone did not want to be a part of Comenius, and the answer is because of paperwork. They’d rather have their students’ parents contribute to the cost of exchanges with students. This is not possible in Norway now, due to “Gratisprinsippet” (the principle of a free education in every aspect).

Before going into the different groups, we were told to remember three things; 1) focus on a common product that should be the result / outcome of this co-operation; 2) focus on a calendar; and 3) find a common title for the partnership. After these four days in Pistoia, we are now 10 teachers from 10 different schools in 4 different countries who wants to apply for a multilateral partnership within the Comenius programme. We have more or less set a date for our next meeting (October), which should be a contact seminar. All of us must now go back our schools / countries and apply for funding for this kind of seminar to make a proposal for this multilateral partnership. Our working title ESCOS (the rest is a secret 😉 ) (Well, the first thing we need are a “good-to-go”- sign from our school leaders / headmasters / principals)

The first half of the sunday meeting was also a teacher’s part. In CarboSchools there have been published two booklets about Carbo-Topics. For the third and final publication they want the teachers’ voice to count – because they want this publication to be something that teachers can use as a teachers’ resource for years to come – also teachers who hasn’t participated in the CarboSchools Programme. When we (teachers) looked at the first draft of the chapters, we said “this is not a book that a teacher will read”, so we got it changed 😉

Personally this discussion pushed my thoughts towards my own teaching, my own curricula in my subjects, and how I can implement some of the aspects in CS more into my classroom. This might be published in a separate blog post later.

In the second half of the Sunday meeting, we had a joint session with TSP (Teachers Scientist Programme). Here we got a presentation of one of the modules that is made in Sweden, and they had some of their students there as well to tell us about their experiences being a student in a TSP module.  Their foci is quite interesting;

  • Benefits of collaborating with scientists: enthusiasm; positive attitude; explanations of complex material in an easy way – but the scientist oneself must be motivated and enthusiastic him/herself, otherwise the students want dare to say anything
  • Before a big project, the students need a solid background in the subject
  • The teacher has to be a good mentor; who helps the students / group in their project planning, and to be a good supervisor along the way. (When the problems get harder, it is nice to be able to contact a scientist that you’ve already met, and that you feel that you “know”)
  • The students felt that they had learnt A LOT, but that the instructions for the project wasn’t good enough, they didn’t feel well enough prepared for such a big project
  • Their advice: let the students read reports from students from last year, and let them work in groups, maybe even a group of 10-12 students together

Written Tuesday night at Firenze and Frankfurt airports, links were added Wednesday when I was back in Bergen.